
Measures and Metrics: Rated Perceived Exertion
June 2025
Welcome back to our discussion of measures and metrics. Last month, we discussed heart rate (HR) and heart rate variability (HRV) and how to use them to guide training. Where we should have started, perhaps, is at the beginning with rated perceived exertion (RPE).
RPE may not seem as earth shattering for training guidance as the first battery-operated monitor in 1977 (invented by Seppo Säynäjäkangas, who later went on to found Polar Electro, and released the first wireless HR monitor in 1982). Indeed, the convenience of recording HR with a chest strap was a major game changer for athletes. Imagine pedaling attached to a string galvanometer. But I would argue that creating a valid and reliable RPE scale was also ground breaking work.
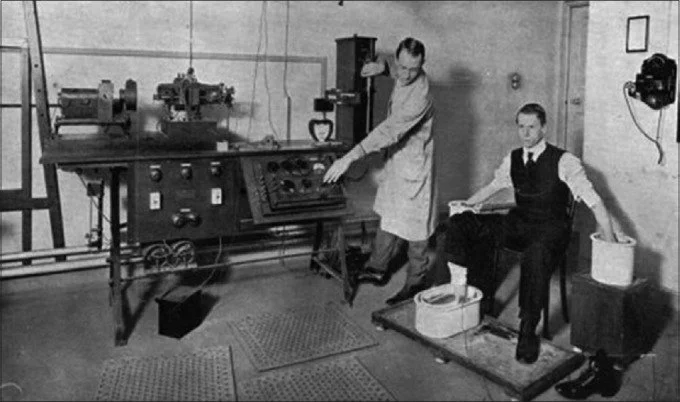
William Eintjoven testing the string galvanometer on a patient, 1916
Prior to chest straps, watches or rings, RPE was one of our favorite things. The RPE scale was developed in 1960 by the Swedish researcher, Gunnar Borg (who recently passed away in 2020 at the age of 92). RPE is rooted in the field of psychophysics, which is predicated on deciphering the complicated relationship between physical stimuli (like exercise) and subjective perceptions of that stimuli on sensory receptors.
Badger Connection: in 1967, Borg started visiting the US to collaborate with Exercise Physiologists, amongst them, Dr. William P. Morgan at University of Wisconsin-Madison. When I entered my doctoral program in the Department of Kinesiology in 1997, Dr. Morgan was a faculty member. It wasn’t until doing a bit of digging for this newsletter that I discovered his involvement with the Borg scale. And it wasn’t until writing this newsletter that I had any real appreciation for the Borg scale as ground breaking work.
Borg pioneered the application of the Harvard experimental psychologist Stanley Smith Stevens’ power law to the study of cycling. In his 1982 paper, Psychophysical Basis of Rated Perceived Exertion, he boils down cycling’s pain cave to the formula R= a + c(S-bn).
With the liberties, I translated it to mean R= hurt rating, S= watts. The constants (a,b,c) are things I can’t explain.
Borg used that exponent, n=1.6, to formulate how RPE increased with power, but also with sensations like “aches and pains” from working muscles, heat, anxiety and age (1985 publication). It is more sophisticated than that, but you get the gist.
I learned that Borg had at least two prior descriptor scales, 7 and 21-point, before the classic 6-20 RPE scale emerged. Observations were made in young (~20-year-old) subjects that exercise intensity of RPE 17 corresponded to a HR of 170 bpm. Max HR was ~200 bpm, and 10% of that peaked the scale at 20. Resting HR was ~60 bpm, so 10% of that started the scale at 6. Bingo! It was simple math to adjust the descriptors of the 21-point scale to the new 15-point (6-20) scale.

This linear category scale allowed comparisons with HR, respiration rate, blood lactate, and oxygen consumption (VO2) which have proven valid (see 2002 meta-analysis).
These images, taken from a 2013 study, illustrate the relationship between RPE, blood lactate and VO2.

Relationships between the average values (SE) of blood lactate [La] and HR, collected at the 5th (empty symbols) and 10th (black symbols) minutes of cycling exercises corresponding to continuous (circles), S1 (triangles) and S2 (squares) protocols for cycling exercises at 160 and 240 W.
This study concluded, “Borg's RPE seems to be an affordable, practical and valid tool for monitoring and prescribing exercise intensity, independent of gender, age, exercise modality, physical activity level and coronary artery disease status.” Brilliant! Affordable, practical, accessible to anyone and everyone, and doesn’t require an app, updates or even electricity.
There was an update in the form of a category ratio (CR) modified Borg scale from 0-10. This scale is used more frequently to rate response to a treatment, or to describe a sensation, such as shortness of breath (dyspnea) during an activity. This is a good segue into ventilation as a measure of exercise intensity, a topic for a future newsletter.
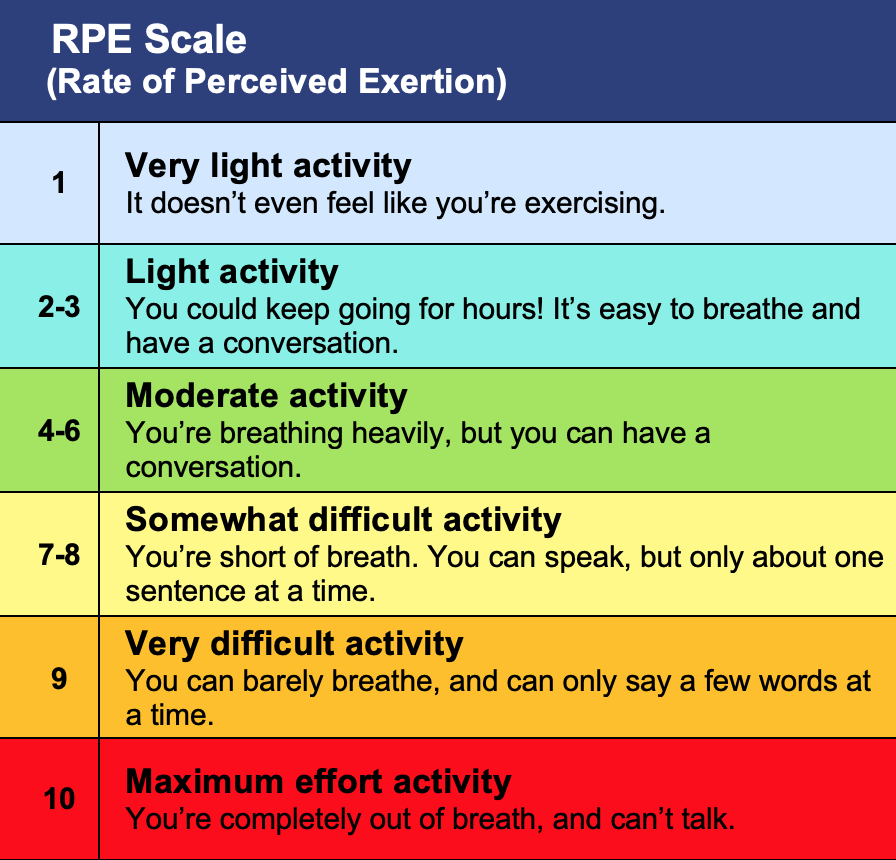
CR Modified Borg Scale
It is no surprise that the American College of Sports Medicine (ACSM) recommended RPE in their Guidelines for Exercise Testing and Prescription in 1986, where is has remained steadfast for the past four decades. Or that they wrote a legacy piece from which I borrowed heavily.
There are skeptics who resist using a subjective rating to describe a physiological state. And to this, Borg responded, “Neither a single RPE value nor a heart rate measure may be used alone as an accurate indicator of ‘dangerous strain.’ They complement each other. Studying fatigue and exertion only from a physiological perspective is as impossible as dealing with color, emotion or motivation in primarily physical or only physiological terms. That is, exertion and fatigue are states with both physiological and psychological aspects.”
As a coach, I find the Modified Borg scale really helpful in communicating with athletes.
Using the Zone Model to describe training intensity, the modified Borg can be used instead of or in conjunction with HR and power.

Like cardiac drift, there is RPE drift with prolonged exercise at a given power output. This is important when communicating a “zone” with an athlete. For example, if the athlete is instructed to hold threshold power of 200W for one hour, the load (watts) remains the same. If the athlete cannot measure power output, they may choose to measure HR or RPE. In this case, threshold corresponds to RPE 5-6 and a HR of 90% max. Over time, there may be cardiac drift, such that HR increases to a higher % of max. And RPE may creep upwards as that athlete experiences muscle discomfort, increase in temperature, blood lactate, increased ventilation, and other factors. If the athlete backs off to maintain a HR of 90% max and RPE of 5-6, the training stimulus (power) is not achieved. It is important to recognize, when describing training intensities, that HR and RPE are responses to load. They can be used to describe an initial load, but they will drift higher than the initial load over time. Similarly, HR and PRE at baseline can be affected by a multitude of factors: hydration, sleep, stress to name a few. If an athlete wakes up with an elevated HR and RPE 2-3 before brushing their teeth, it might be time to consider lowering the training load. This is where coaching and training is both a science and an art, and Borg was both an Einstein and a Picasso. My appreciation for this scale has reached a 10.