
Measures and Metrics: Mania or Madness? Heart Rate and Heart Rate Variability
May 2025
Do you remember the days, or maybe are still enjoying them, when you simply went out for a bike ride? If you have gotten caught up in measures and metrics, your pre-ride routine may be a bit more complicated than merely checking your tire pressure (and tire pressure has evolved from riding 120 psi on 23mm) and Cat Eye computer. For those too young to remember, those revolutionary bike computers were hard wired with a cable running from your fork up to your computer mount on the handle bar, secured with zip ties, hopefully connecting without physically touching the sensor precariously attached to a spoke, calculated your average speed and total distance. In modern times, you are likely securing your HR monitor chest strap, ensuring good connectively by spitting on the electrode, firing up your Garmin/Wahoo and trying to recall the steps (for the hundredth time) to upload a course or workout, and calibrating your power pedals (after remembering that you forgot to put in new batteries). And that’s after reviewing all of your sleep, heart rate variability, stress level and body battery metrics to determine your training readiness. I rather miss those days when I just checked in with how I felt. After the criterium cornering clinic on Sunday (thanks to Reece Linder at Ascend Performance), my Garmin noted that I needed 60 hours of recovery. Really?
The questions top of mind are these:
What is the difference between a measure and a metric?
What do these measures and metrics mean? The May newsletter is the first in a series of measures and metrics, with a focus on heart rate and heart rate variability.
How do I use measures and metrics to guide my training?
Measurements versus Metrics
Measurements are made, metrics are created, derived or estimated from measurements. Measurements need to be valid and reliable. Validity means the measurement actually measures what it claims to measure, and does so accurately. Reliability is consistency of that measurement in similar conditions. If the measures aren’t valid or reliable, the associated metrics are even less so. Let’s dive into heart rate (HR) and heart rate variability (HRV) to illustrate the difference between measures and metrics.
Heart Rate
HR is the number of times your heart pumps blood per unit of time, expressed as beats per minute (bpm). You can measure HR by putting a finger to your carotid, brachial or radial artery and counting beats for 60 seconds. Your physician might order a test called an electrocardiogram (EKG) to measure the electrical activity of your heart. An EKG maps out the time intervals between electrical events of the atria and ventricles (chambers of the heart) to diagnose arrhythmias or ischemia. Below is a sample strip of what the electrical activity looks like in a normal cardiac rhythm, along with labels of the specific waves and intervals.

Normal EKG
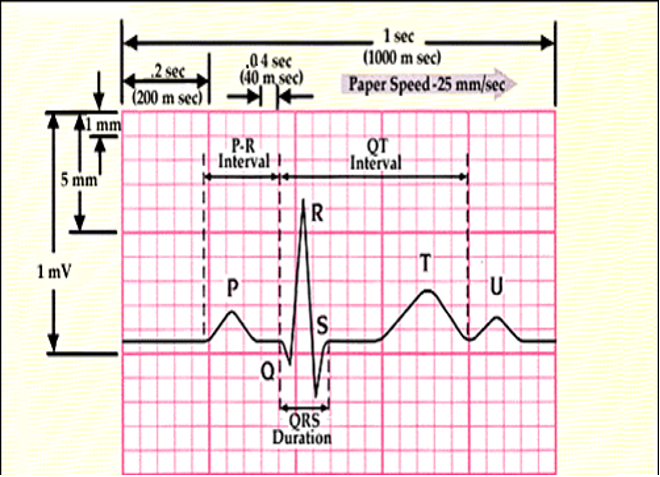
Waves and intervals
Somewhere in between these methods, athletes can determine HR by wearing chest straps, wrist straps and rings. Chest straps use an electrode sensor to measure the electrical activity of the heart, similar to an EKG. Wrist straps and rings use an optical sensor to measure changes in blood volume under the skin (hence the light that shines under your watch or ring) called photoplethysmography (PPG). HR can be deduced by the time between changes in blood volume. I would argue that this is a metric more so than a measure.

Garmin HR strap and Instinct watch
Optical technology is subject to error due to motion artifact (the sensor moving on the skin) and signal crossover (repetitive motions in running or cycling are misinterpreted as the periodic signal of interest). According to one study, error increased up to 30% with activity (Apple, Garmin and Fitbit devices, not all are not all created equal) compared to rest. Specifically, the sensors tested were 4-10 bpm off compared to EKG testing at rest, and up to 20bpm off while walking (not even vigorous activity).
Key Point: chest straps measure HR through electrical signal and are more accurate than wrist straps, which deduce HR and are prone to error through artifact and signal crossover. Heart rate readings at rest are more reliable than during exercise for PPG devices.
What do resting and maximal HR numbers mean?
The heart is our most amazing muscle. It can beat on its own, without input from our brain. In the case of a heart transplant, only the vessels are reconnected to the donor heart, not the nerves, and yet the heart beats and effectively changes pace in response to hormones. Although it can beat to its own drum, the heart is innervated and controlled by the autonomic nervous system (ANS). There are two branches of the ANS: sympathetic and parasympathetic. Sympathetic is often referred to as “flight or fight” and parasympathetic as “rest and digest”.
Heart rate tells us how much influence comes from those branches of the ANS. Left without innervation, it would beat on its own around 100bpm. The lower that number, the more the parasympathetic system is pumping the brakes. The higher the number, the more the sympathetic system is hitting the gas in response to some flight or fight stimulus, like exercise.
Monitoring heart rate has implications for cardiovascular health and monitoring exercise. Resting heart rate (RHR) in adults has a wide range from 60-100bpm. A HR below 60rpm is called bradycardia and above 100bpm is called tachycardia. Simply stated, slow and fast rates. A low RHR is an indication of cardiovascular fitness. Some endurance athletes have non-pathologic bradycardia in the low 40s.
HR can be affected by posture, sleep, stress, pain, caffeine, nicotine, and heat. Therefore, it is best practice when tracking RHR to do so upon waking. A drop in RHR may be a positive sign of adaptions to training. An elevated RHR may indicate onset of illness or dehydration.
While RHR provides insights into cardiovascular health, maximal heart rate (HRmax) is much less interesting. HRmax invariably goes down with age, starting roughly around age 25 at a rate of ~1 beat per year. HRmax is not a reflection of fitness, although determining HRmax is important for setting training levels or zones. It can be estimated with formulas but it is more accurate to find your HRmax with a field test (unless you have the means to test in a lab with a metabolic cart).
· [220-age] is the most common and inaccurate)
· [207- (0.7 x age)] more precise for people over 40 y/o
· [211-(0.64 x age)] slightly adjusted for active people
· Warm up 5min, hard effort for 10min with last 30s all out. Average three trials with a day of rest in between.
Key Point: RHR gives insight into fitness while maxHR is a gauge of age.
How do I use HR in training?
HR during sub-maximal exercise is about supply and demand. As you pedal your bike, the demand for energy to do physical work increases. Your body responds to that demand by supplying more blood, and therefore oxygen, to working muscles. It does this in part by increasing HR.
Monitoring the response of HR to sub-maximal exercise provides powerful insights into training stress and adaptation. At rest and sub-maximal work rates, a trained person will be better adapted and able to meet the demand and therefore will demonstrate a lower HR for a given power output. Conversely, an acute decrease in HR at a sub-maximal work rate can indicate over-reaching (the predecessor to over-training).
Can I use HR to determine intensity targets, levels or zones?
Realize that HR is a measure of strain, or response to an application of load (stress). For those cyclists who don’t have the luxury of training with power meters, it is tempting to execute workouts using HR as a guide. We will save zone or level training for a future newsletter. For now, it is important to appreciate the inherent danger in setting a target HR as a means to guide your intensity. The load is what is what it is: 100W, 200W, 500W. HR is a marker of internal stress in reaction to the intensity or load placed upon it. It is NOT the load. If you are relying on HR to hit a certain target power, you might be overshooting or undershooting the target. Furthermore, recall that HR is impacted by sleep, hydration, stress, pain, caffeine, nicotine, and heat. HR cycling at 200W at 60 degrees is going to be lower than cycling at 200W in 90 degrees.
Should I use HR as a surrogate for VO2max to monitor training?
Increasing oxygen consumption is a well-orchestrated dance with the respiratory and cardiovascular systems partnering up to increase ventilation, heart rate and intensity of pumping, and redirecting of oxygenated blood to the working muscles.
Oxygen is used in a clever combustion chamber called the mitochondria to burn fats and carbohydrates to provide energy in the form of adenosine triphosphate (ATP) to working muscles. The rate of work (think power) is matched in a linear fashion by oxygen consumption (VO2) until a maximal point (VO2max) is reached. Power can still increase, but beyond VO2max, energy is derived from non-oxygen or “anaerobic” sources.


VO2max is the gold standard for assessing cardiovascular fitness. Measuring oxygen consumption requires lab testing with a metabolic cart, which is expensive and not practical for most athletes. Due to the linear relationship of VO2 and HR with work rate, devices often use HR as a surrogate for estimating VO2 max.
After conducting hundreds of VO2max tests in the lab, I can assure you it is an estimate calculated by proprietary algorithms and not a true measure, although perhaps an interesting metric. The chart below, generated in Garmin Connect, is a good example of how HR data is used to estimate VO2max.
Key Points: a decrease in sub-maximal HR response to a given work rate is a key indicator of chronic fitness adaptation or acute over-reaching. Caution should be exercised when using HR to target load, as it is an internal measure of stress to a load. Training HR can be used to estimate VO2max. That metric does not predict performance.
Heart Rate Variability
HRV is the variation in time between beats, measured by the R-R interval on an EKG reported in milliseconds (ms). It is a metric. The actual interval is measured between beats is measured, but the variability number is calculated using an algorithm.

Recall that a chest strap utilizes a sensor to read electrical activity, whereas wrist straps and rings use optical sensors and PPG, which are prone to artifact. Technically, these devices measure pulse rate, not HR, if you want to get snippy about it. Which apparently, I do, because that measure is now put into a calculation to come with a metric, HRV, so it should be valid and reliable.
To further muddy the waters, HRV calculations are often (always?) proprietary. This is above my pay grade as it involves math, my nemesis. The calculations can be time-domain or frequency-domain methods, as described in the table below.

Key Point: HRV is a metric calculated from a measuring an electrical signal from the heart. How that signal is measured (electrode or PPG) will impact the accuracy of the number. The actual number is a metric that comes from a proprietary algorithm, so cannot be compared across devices.
What does HRV mean?
Remember that the heart is innervated by the parasympathetic (vagus nerve) and sympathetic (cardiac nerves) of the autonomic nervous system. The balance between these branches is called “tone” and is reflected in HRV, with a high HRV being an indicator of health.
Tone responds to many variables, including exercise and stress. Increased sympathetic tone increases HR. Perhaps a bit counterintuitive, increased sympathetic tone decreases HRV. Think about it in terms of flexibility: if the gas pedal is all the way down (sympathetic tone), there is little variation in speed (heart rate). When the foot is on the brake (parasympathetic tone), there are fluctuations in speed just be removing the brake, and even more by hitting the gas. This leaves the body more flexible to adapt to internal and external stimuli.
A 2020 study by Tegegne et al., used 10 second resting EKG measurements to establish references for HRV based on age, sex and fitness.


Key Point: The autonomic nervous system with sympathetic and parasympathetic branches impacts all systems of the body. Tone is a reflection of the cardiovascular, digestive, respiratory and other systems ability to react and adapt to stimuli. A higher HRV is an indicator of overall systemic health.
How do I use HRV in training?
Since HRV numbers are generated from non-disclosed secret sauce algorithms, comparisons between devices are meaningless. I found this graph from LifeHacker very helpful in visualizing the different ranges in HRV and RHR based on several common devices (Whoop, Oura, Apple Watch, Fitbit and Garmin).

This is important for coaches to understand, as they may be looking at HRV data from many athletes using various devices. And for athletes using one device, it is important to understand that reference norms were established using gold standard EKG measurement of the R-R interval, not PPG.
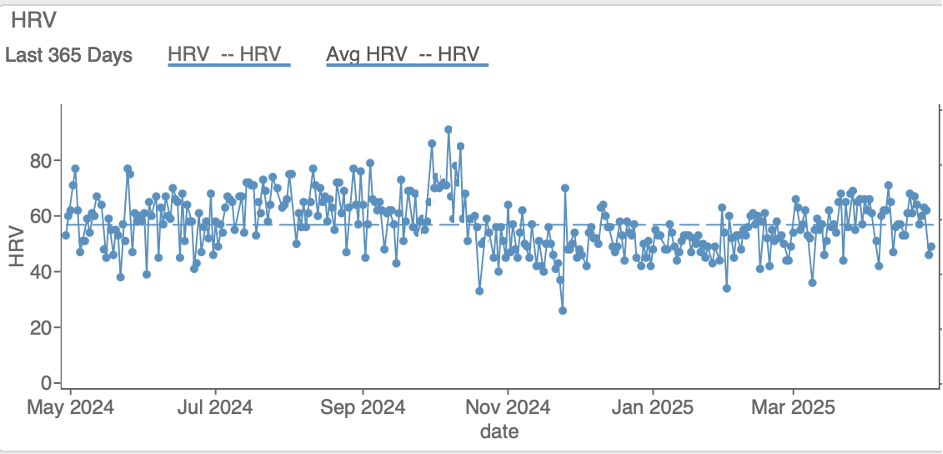
However, not all is lost. The cyclist looking at HRV from one device can gain insights into their training by ignoring absolute numbers and following trends. Here is an example of an athlete’s HRV tracked over the course of a year. She had a 100-mile gravel race in October. During the taper, HRV was at its highest, and then dramatically dropped the day following the event. Slowly, through the off season and pre-season, it has climbed back up to baseline.
Key Point: HRV is an indicator of autonomic nervous system tone and overall health. In general, a higher number reflects more “flexibility” of the system to adapt. This number should not be compared across devices. Reference norms provide some insight, but be mindful of the errors inherent to wearables, particularly devices utilizing PPG when drawing conclusions. Cyclists may gather information about their readiness to train by following trends in HRV using the same device with data collected at the same time of day (preferably overnight or upon waking).